v9.2.214 [Dec 19, 2014]
User Interface
Introduces MS Office Style Collapsible Menu for some very long menus and context menus so only commonly used ones show by default. Users can access items not frequently used via the double down-arrow at the bottom of the menu.
Project Explorer
The Project Explorer in Origin was designed to provide easy control of hierarchy project structures. In Origin 2015 it has been improved with nicer interface and find & search functionality:
- View in Extra Large Icons
- Graph Preview and Tool Tip
- Find String Anywhere in Project
Set Column Values
The Set Column Values dialog is one of the most basic tool in Origin, which is used to carry out column-based calculation with formulas. In 2015 it is highly improved with more intuitive tool tip and function help:
- Search and Insert Functions
- Tool Tip for Function Syntax
Graphing and Analysis
Improvements are targeted to provide easier and user-friendlier control options with both graphing and analysis:
- User-Defined Order for Categorical Data
- Colored Pairs of Parentheses in Function Formula
- Batch Plotting in 3D and Contour Graph
Axis Dialog
Axis Dialog has been redesigned with visual icons on the left panel for easy navigation. Meanwhile, more customization options on axis (line, ticks and labels, special ticks) are provided, including wrap tick label.
Bubble Scale
The bubble scale can be shown as nested or linear layout and you have full control on its customization.
Color Scale
Full control with color scale display is provided by the new Color Scale Control dialog.
Analysis and Statistics
- Distribution Fit
- RMANOVA with Unbalanced Data
- t-Test on Rows
- Share 6 OriginPro features with Origin
Data Management
- Append Worksheets
- Remove/Combine Duplicate Rows
- Pivot Table with Multiple Source Rows/Columns
Importing
- Import Transposed Matlab Data
- SPSS File Import
- Extract Long Name and Units from Same Line
v8.6.0.70 [Dec 12, 2011]
64-Bit Support
Origin 8.6 is available in both native 64-bit and 32-bit versions. The 64-bit application provides:
- Improved memory management
- Improved handling of large datasets
- Memory capacity limited only by installed hardware (32-bit application limited to 2 GB)
Note: Individual worksheet columns and matrices are limited to 90 million elements each.
Zoom and Scroll inside Graph Layer
Use the mouse and scroll wheel, or use the keyboard, to zoom and scroll inside a graph layer, in either X or Y direction. Quickly identify data sub range of interest and then use tools such as gadgets to analyze your selection.
Auto-hide Capability for Dockable Windows
Set dockable windows such as Project Explorer, Quick Help, and the new Messages Log, to auto hide mode. This frees up space in the Origin interface, and you can easily access these auto-hidden windows when needed. Some windows such as Messages Log will pop up even in auto hide mode, to display important messages.
New Gadgets
Based on multiple requests from our users, we have added three new gadgets in this version:
- Vertical Cursor
Read X and Y coordinates of multiple data plots inside a layer or even across multiple stacked layers. Output the coordinate values to a worksheet, or tag your data with a line and label at desired X values.
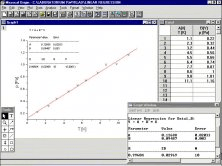
- Quick Sigmoidal Fit
Perform a quick sigmoidal fit to data within a region of interest. Select from multiple built-in fitting functions or use your own fitting function. Display asymptote lines and optionally fix parameters to desired values.
- Intersect
Calculate the intersection points of multiple curves within a graph layer. Tag the intersection points and send the coordinate values to a worksheet.
Auto-detect the X-axis type, and set an appropriate fitting function. The fly-out menu can be used to change data, change function, switch to the NLFit dialog, show/hide asymptotes, or open the Find X/Y dialog.
Sigmoidal Fit Gadget
Interpolate the input curves to find the nearest intersection points. You can tag and label the intersection points in the ROI area on the graph.
Curve Intersect gadget
Add multiple tags on a graph. Drag by the handle, or enter an X value in the dialog, to place on the reference layer
Vertical Cursor
Spider/Radar Chart
This new plot type is ideal for displaying and comparing multivariate data. A custom dialog is provided for control of axes, including the ability to set each axis to a different scale.
With a few datasets, Origin’s color transparency feature can be used to overlay datasets for comparison. With many datasets, it is easy to set up the plot properties and then separate out the datasets to multiple layers to compare them side by side.
Parametric Function Plots
Create 2D function plots using parametric equations. Save your favorite equations as themes for repeat use. Modify the plot parameters in Plot Details dialog at any time, and copy paste the settings from one plot to another.
Enter the parametric equations for X(t) and Y(t) to express the relationship of X and Y.
- K-Means Cluster
- Hierarchical Cluster
- Discriminant Analysis
Nonlinear Fitting with Integral
The Fitting Function Builder has been updated to support creation of user-defined fitting functions that included an integral.
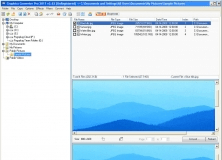
Worksheet Navigation Dialog
This new dialog allows you to view and manage multiple sheets in a workbook or a matrix window. Sort the list of sheets by name, size, and other meta data properties. Change the order of sheets, or select multiple sheets to duplicate or move to a new book.
Import Menu Customization
Origin imports many widely-used third party data formats using custom dialogs acccessible from the File: Import menu. This new version provides a dialog to customize the sub menu to add/remove file types.
v8.5.1.315 [Sep 8, 2010]
Gadgets
-Cluster Gadget
-Quick Peaks
-Statistics Gadget
-Digitizer
Graphing
-Color Palette Improvements
-New Layer Contents Dialog
-Mean line option added to Box Chart
-Bin number control added for Histogram plot
-Error Bar Plot Improvements
-Axis Tick Locations from Dataset
-Improvements on Saving and Loading Incremental -Graph Themes
-Drop-down to control Substitution in Legend Text
-New context menus for Layer Icon and Spline Line Types
Analysis & Statistics
-Surface Fitting with Multiple Peaks
-Improved Multiple Peak Fit Tool
-NLFit Improvements: Michaelis-Menten Function, improvements to Parameters Tab and Find X/Y
Import & Export
-SQL Editor for Database Import
-Graph Export: Transparency Support for PDF and EPS formats
-Data Import: New 3rd Party Formats, Custom Time formatting
Worksheet
-Improved Context Menu for Column Label Rows
-Horizontal and Vertical Dividers to Split Worksheets
-Stack Columns and Unstack Columns Improvements
-Pivot Table Dialog Improvements
-Define LabTalk Function in Before Formula Script in Set Values dialog

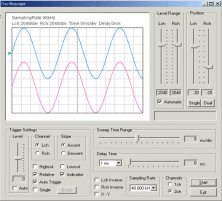
It turns your computer into a modern, State-of-The-Art spectrum analyzer.